

This post “Introduction to Time Series”, will explain a popular type of data which is widely used for extracting business insights.
Time Series (TS)
A time series (TS) is a collection of observations made sequentially over a period of time. In other words, the data on any characteristic collected with respect to time over a span of time is called a time series. Normally, we assume that observations are available at equal intervals of time, e.g., on an hourly, daily, monthly or yearly basis. Some time series cover a period of several years.
The methods of analyzing time series constitute an important area of study in statistics. But before we discuss time series analysis, we would like to show you the plots of some time series from different fields.
We will look at the plots of three time series:
- time series with trend effect
- time series with seasonal effect
- time series with cyclic effect
These plots are called time plots.
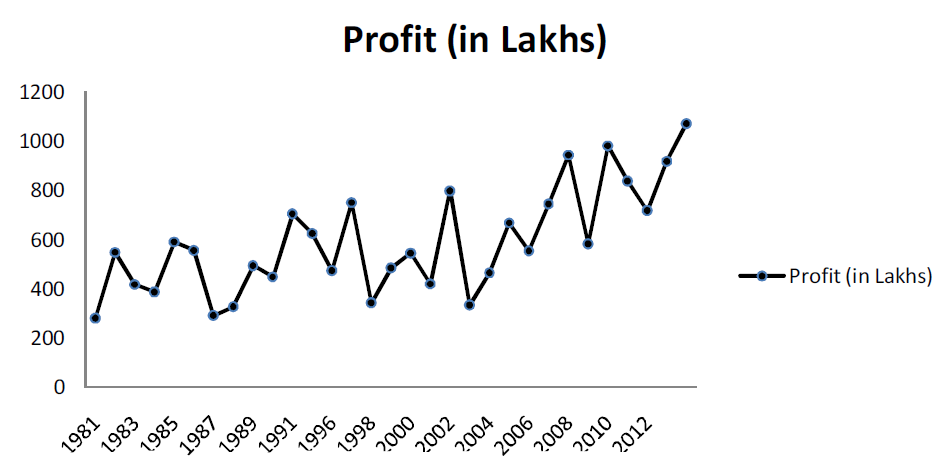
Time Series with Trend Effect
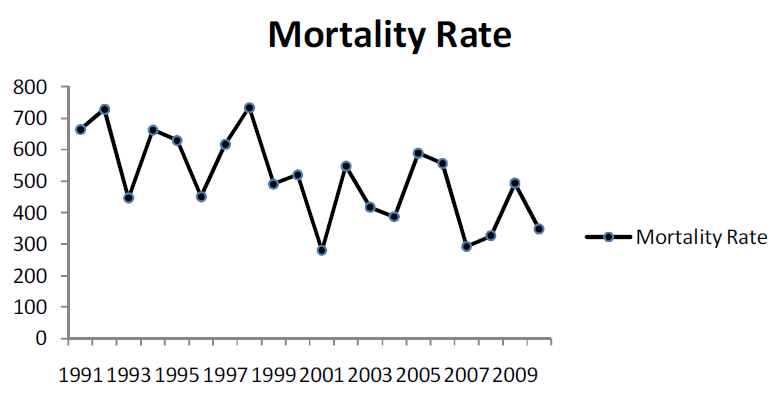
A trend is a long term smooth variation (increase or decrease) in the time series. When values in a time series are plotted in a graph and, on an average, these values show an increasing or decreasing trend over a long
period of time, the time series is called the time series with trend effect.
Time Series with Upward Trend
Time Series with Downward Trend
Time Series with No Trend

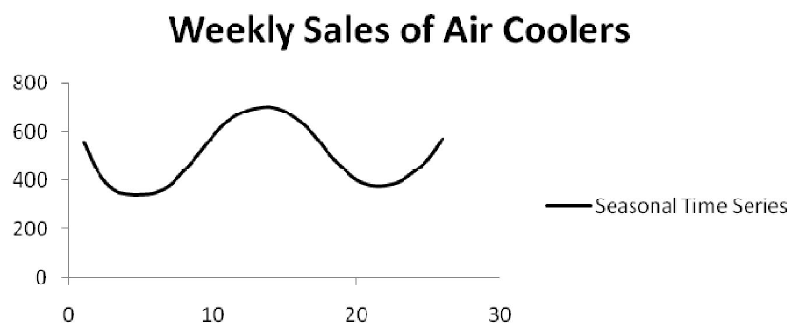
Time Series with Seasonal Effect
If values in a time series reflect seasonal variation with respect to a given period of time such as a quarter, a month or a year, the time series is called a time series with seasonal effect. For example, the time plot of the data of
weekly sales of air coolers shows a seasonal effect.
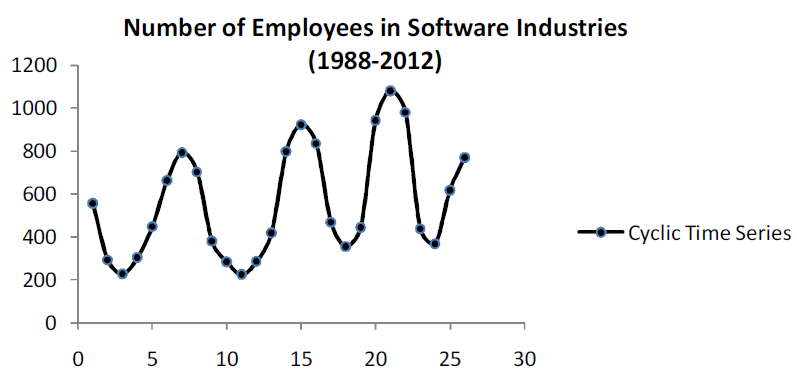
Time Series with Cyclic Effect
If the time plot of data in a time series exhibits a cyclic trend, the time series is called a time series with cyclic effect. For example, time series data of the number of employees in software industry in different phases, i.e.,
phases of prosperity, recession, depression and recovery shows a cyclic pattern, that is, the pattern repeats itself over an almost fixed period of time.
Conclusion
So far, you have learned about different types of time series plots which exhibit different trends in data. These trends arise due to the effect of various factors on the variations in data.
Hope this post “Introduction to Time Series” helped in learning a new concept in AI.
You may also like:
Check out the table of contents for Product Management and Data Science to explore these topics further.
Curious about how product managers can utilize Bhagwad Gita’s principles to tackle difficulties? Give this super short book a shot. This will certainly support my work.
Thank you!!1
Excellent, what a website it is! This weblog provides helpful information to us, keep it up. Neilla Ron Chen Maribelle Broddy Augusto